History of the Universe
Scale of the Universe:
Big Bang Theory Notes:
Big Bang Simulator
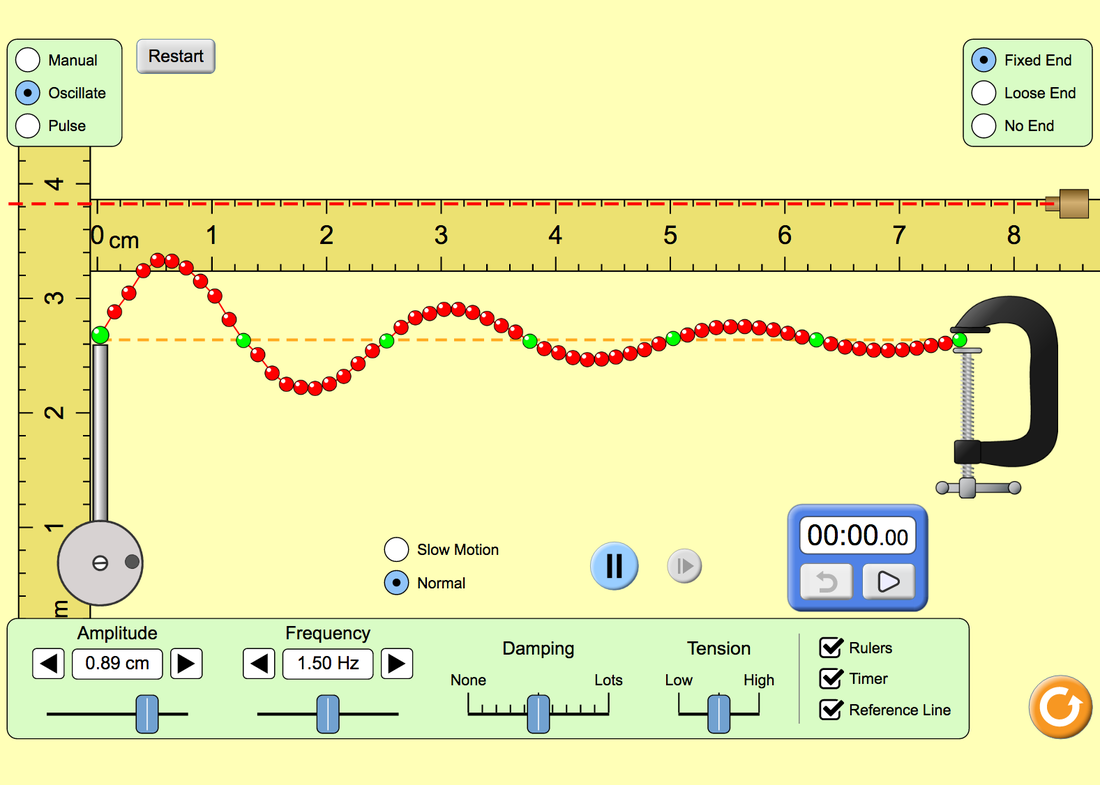
Wavelength Simulator:
As wavelength increases, frequency decreases.
As wavelength increases, frequency decreases.
Spectral Line Shift:
Red ahead, Blue to you
Red has a longer wavelength and blue has a shorter wavelength, All galaxies have a red tint meaning that they have a longer wavelength and are moving away from us. See Doppler Effect for more information.
Red ahead, Blue to you
Red has a longer wavelength and blue has a shorter wavelength, All galaxies have a red tint meaning that they have a longer wavelength and are moving away from us. See Doppler Effect for more information.
|
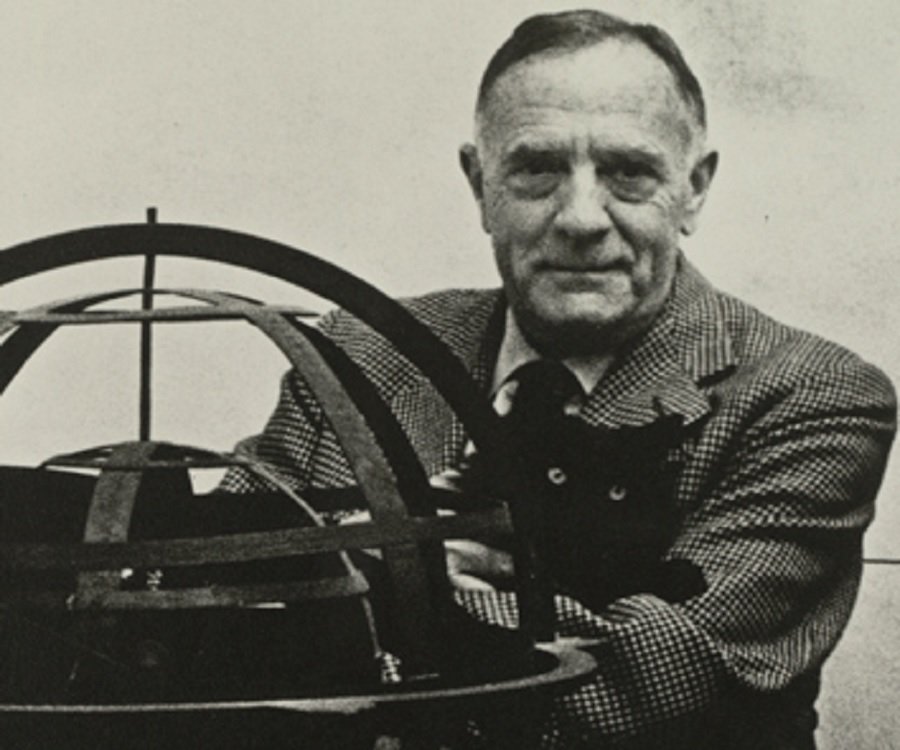
Hubble's Law:
Edwin Hubble was an American astronomer who discovered the universe is expanding. The Hubble Telescope (made years later, was named after Hubble to honor his findings in the field of astronomy. Read through the notes below to learn more about Hubble's Law. |
Doppler Simulator
Life Cycle of a Star:
|
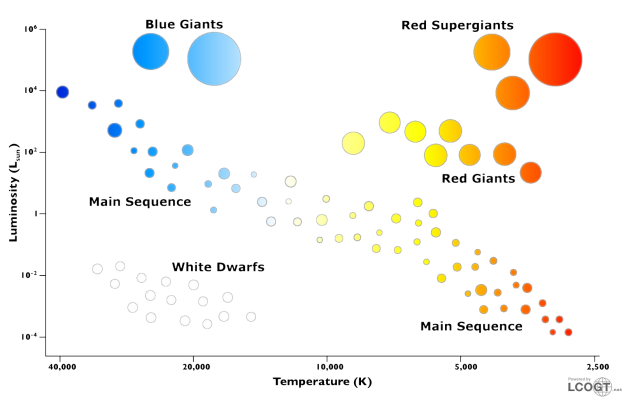
HR Diagram:
A star's life cycle is determined by its mass. The Surface Temperature X-axis increases from RIGHT to LEFT. The Luminosity Y-axis is a logarithmic scale so values go up by powers of 10. Early Stage= MAIN SEQUENCE Intermediate Stage= GIANTS or SUPERGIANTS (depending on mass) Late Stage= WHITE DWARFS |
|
|
|
Interactive HR Diagram lab: Click on the buttons below to learn more about each star. Then plot on your HR diagram. Find the color based on the temperature here.
